Stuff I've worked on for fun and profit.
Projects Overview
I've worked on a number of projects to solve problems for myself or other people. The projects below show the breadth of things I've done, from building an interface in an embedded device to web sites and Android apps. This web site has even been a project of mine, learning new skills like Gatsby for React-based static site generation and AWS Amplify for super simple deployment and hosting.

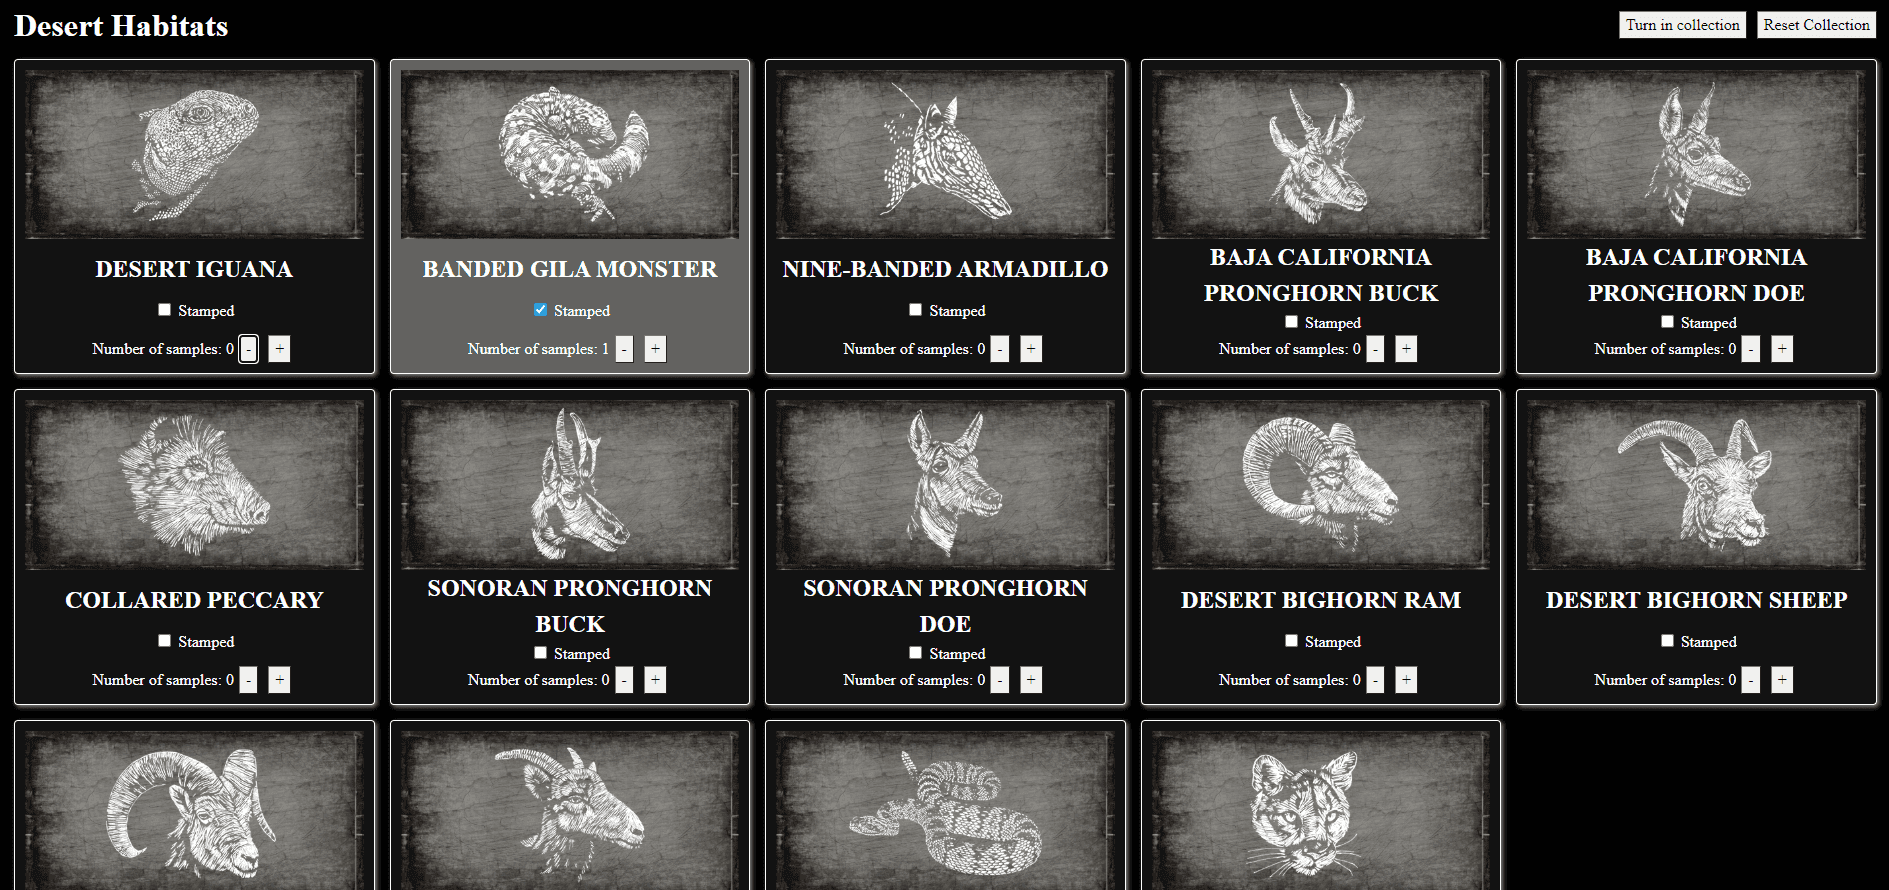
RDR Online Naturalist Tracker
I wanted an easier way to keep track of my progress through the Naturalist role in Red Dead Redemption Online, so I built this tracker application in React and deployed it to Amplify. It uses the LocalStorage API to keep track of your progress locally between sessions - no accounts or databases needed. This was a lot of fun and a really simple project to work on.

Enter/Locked Room Timer
Kayla and I built a timer display for a local escape room. The device, built using Python Flask running on a Raspberry Pi 3, showed the remaining time and other info for the players in the room, designed to look like a old dial TV. It used a web backend built with Vue for the game master to control the display.

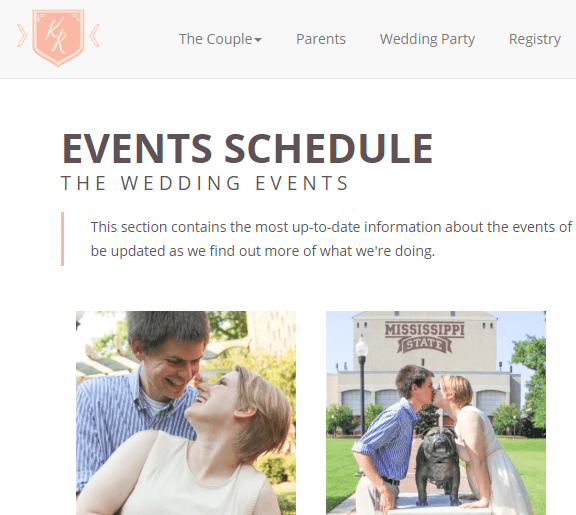
Wedding Website
For our wedding in 2016, my wife, Kayla, and I built our own responsive wedding website. We created an RSVP form that used cookies to track whether a user had filled out the form before. Visitors could view travel info and learn about the schedule and wedding party.

GPS Volume Android App
GPS Volume is an Android app that mimics the speed-controlled volume found in many newer cars. This app uses the GPS reported speed of your phone to set the media volume to a customizable level. Android app written in Java and using the Android SDK.

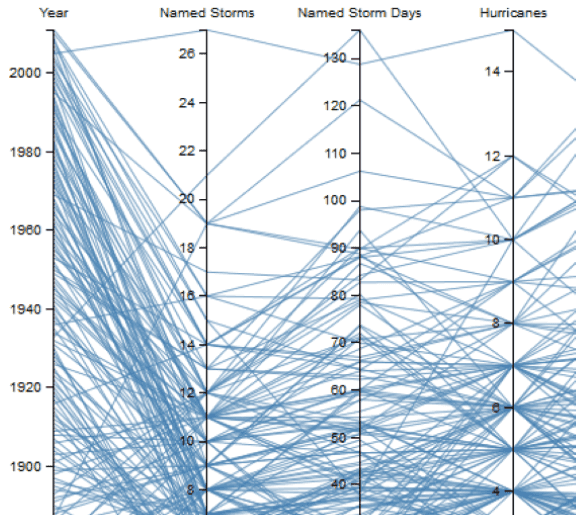
Hurricane Visualization
A parallel coordinates display of Atlantic hurricane season data from 1851-2011. A parallel coordinates display is useful for showing high-dimension data. Written using d3.js and jQuery, along with standard HTML and CSS.